Become a Toolmaker

In previous posts, I have discussed reducing a problem into its simplest form, and possibly even writing a representative executable to (a) demonstrate the problem, and (b) validate a fix. Today I would like to discuss a variation of that, writing code to simpify the diagnosis of recurring problems.
The Known Issue
In larger organizations, where the code pipeline is strictly controlled – the antithesis of CICD – there will invariably be cases of "the known issue", a problem in shipping code that has been identified, and possibly even with a fix in the works. When a customer reports a problem, there will need to be a bunch of diagnosis during the bug triaging to clearly categorize it as a known issue, and to make sure it is not something else entirely. How it is categorized then defines the steps that follow.
As discussed several weeks ago, making use of tools to chew on logs is standard fare for a master debugger. However, when we are repeatedly triaging bug reports and doing the same steps over and over, then no matter how powerful your toolset is, the process can become very tiring.
Make your tools
tool (noun) : a device or implement, especially one held in the hand, used to carry out a particular function.
The whole point of tools is to make your life simpler. Sure, you could try and push a nail in with your hand, but a hammer makes it considerably easier. Likewise, when you are doing the same triaging over and over, and your workflow involves multiple steps and multiple tools, it makes sense to consider writing a new tool that does the exact analysis you want.
Consider this scenario. The normal triaging for "customer missing data" is:
- Use Tool 1 to grab logs from an archive server for the date in question. Note that because the servers are load-balanced, there are multiple logs. Also, different customers are on differents sets of servers, so we need to identify which specific logs to pull.
- Export logs from Tool 1, and feed into Tool 2. This involves a network copy to move files from one domain (production) to another.
- Use Tool 2 to filter logs for specific customer. The customer is not directly identified in the logs, for security purposes, so you need to make a trip to Database 1 to get the identification "key" for the customer.
- From filtered results, examine timestamps to look for gaps around time of missing data. Also look for logged exceptions around the time in question.
- If this is "the known issue", then also look at execution times of successfully logged items, since it is known that if something takes too long to process, the customer application will time out.
After doing this workflow dozens of times, you will get pretty good at it. You'll have saved queries to do the database lookups, and possibly a bit of automation in your log processing tools. Nonetheless this is tedious, and a poor use of your skills.
But now consider that:
- A simple command-line tool can do database lookups very easily.
- A simple command-line tool can grab files from an archive server very easily.
- A simple command-line tool can be tuned to filter for a specific customer (passed on the command line), do "gap analysis", parse log entries to watch execution times, and spit out "pass/fail" results.
- A simple command-line tool can be handed off to anyone to execute.
Now there is always this balance of effort vs. reward, and clearly writing a tool from scratch will take a bit of time. But in my experience, that time is usually way less than what you think because it is just a tool and so you can cut whatever corners you need to get the job done. And if your manual workflow takes "x" minutes, how many x's do you need to accumulate before the tool pays for itself?
My guess is not many.
Update
Since writing the above, I wanted to share my experience with creating such a tool to optimize my triage workflow because I feel it is both illustrative and typical.
Despite my having "grooved" the workflow in terms of the various tools I had been using, a typical triage effort takes 15-30 minutes and, lately, I have been doing that every 1-2 days. So I justified (to myself) that spending a day writing a tool could be worth it. The tool took 1.5 days to complete, including a bit of polish with help text and Git repo README.
More important, the tool reduced the triage time from 15-30 minutes to 30 seconds or less. This included some fairly deep analysis of the log data to highlight all of the potential failure cases that I have been triaging over the last several months.
That is a 60x improvement in triage time.
Additionally, this tool can now be handed off to other people to do the same analysis, freeing me to focus on issues that are bubbled up after the triaging has been done.
println
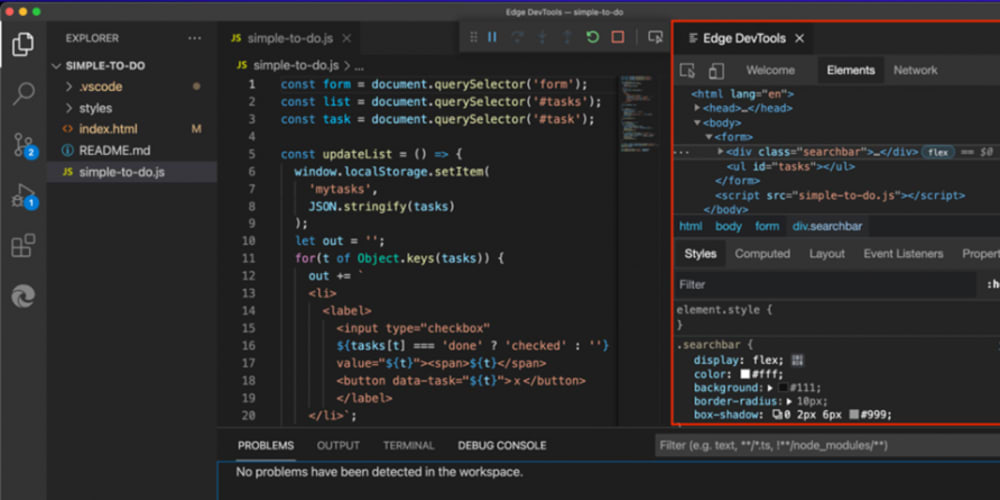
Here are some debugging-related posts I came across this week that caught my eye. I don't do a lot of JS and NodeJS work, but have done in the past. Maybe this will be useful to you.
(Yes, they are both from dev.to, but that is just coincidence.)


As a final word, I would welcome any feedback on this or any of my other posts. If you like what you are reading, or not, please let me know. And I would like to also make a call out for things that you would like to read here. One thing I am considering is a "The Debugger Is In" kind of thing where you submit debugging problems and we work through them and summarize it here. Half-baked at present, but it might work.


