Patronus

The ELK stack is a very common way to collect, aggregate, and analyze log data. It is used by large enterprises and small teams owing, I think, to its use of open-source software and the ability to be self-hosted, or use managed services, as is your preference.
Last week, I discussed the "L" of the stack or, more precisely, the "F" variant of the similar "EFK stack": using FluentBit to collect logs from disparate systems and do something with them.
In the ELK/EFK model, the "do something" means ship the logs to Elasticsearch, where it is archived and indexed, and then analyze the data using Kibana. In this post, we'll look a bit more deeply into that.
Elasticsearch
From Elastic.co, the company that is the gatekeeper for ELK:
Elasticsearch is a distributed, RESTful search and analytics engine capable of addressing a growing number of use cases. As the heart of the Elastic Stack, it centrally stores your data for lightning fast search, fine‑tuned relevancy, and powerful analytics that scale with ease.
It is industrial-strength, used by many, many, many companies, and also forms the basis of the AWS offering of the same name (although Elastic goes to pains to differentiate themselves from that).
But I think one of the really huge selling points is this:
Go from prototype to production seamlessly; you talk to Elasticsearch running on a single node the same way you would in a 300-node cluster.
It scales horizontally to handle kajillions of events per second, while automatically managing how indices and queries are distributed across the cluster for oh-so-smooth operations.
As described below, you can take advantage of that to prototype a system and demonstrate the value proposition easily and effectively.
Kibana
While you can certaily query an Elasticsearch database using REST, that is far from convenient. And so the "K" of the ELK/EFK stack is a critical component of the system. Again from Elastic.co:
Kibana is a free and open user interface that lets you visualize your Elasticsearch data and navigate the Elastic Stack. Do anything from tracking query load to understanding the way requests flow through your apps.
It provides the following powerful functions:
- intuitive search of data
- dashboards to visualize data in charts, graphs, and counters
- administrative functions to manage the Elasticsearch archive
Additionally, Kibana can pull data in from other sources too (like Prometheus, for example) so you can use it as your one-stop shopping for logs and metrics. In fact, you may already be using Kibana and so pointing it to Elasticsearch may be all that you need to do.
Quick and Dirty
Assuming that you do not have any ELK/EFK infrastructure in place, how do you get started? Docker, of course. It turns out to be trivially easy to start up an Elasticsearch and Kibana instance using docker-compose, and then point FluentBit at it to deliver the data.
Use the following YAML to get the stack going with a single Elasticsearch node:
version: '2.2'
services:
  es01:
    image: docker.elastic.co/elasticsearch/elasticsearch:7.13.1
    container_name: es01
    environment:
      - node.name=es01
      - cluster.name=es-docker-cluster
      - cluster.initial_master_nodes=es01
      - bootstrap.memory_lock=true
      - "ES_JAVA_OPTS=-Xms512m -Xmx512m"
    ulimits:
      memlock:
        soft: -1
        hard: -1
    volumes:
      - data01:/usr/share/elasticsearch/data
    ports:
      - 9200:9200
    networks:
      - elastic

  kib01:
    image: docker.elastic.co/kibana/kibana:7.13.1
    container_name: kib01
    ports:
      - 5601:5601
    environment:
      ELASTICSEARCH_URL: http://es01:9200
      ELASTICSEARCH_HOSTS: '["http://es01:9200"]'
    networks:
      - elastic

volumes:
  data01:
    driver: local

networks:
  elastic:
    driver: bridge
Start it up with docker-compose up and then go to http:\\localhost:5601\ to confirm that it is running.
On the FluentBit side, you now merely need to create an output that points to this Elasticsearch instance to populate data. Note that one of the really powerful features of FluentBit is that you can define multiple outputs based on your requirements, so you can, for example, ship all log events to Elasticsearch, but then also ship error events to the console.
In the following snippet, all log events are pushed both to the console and this new Elasticsearch instance:
[OUTPUT]
    Name        stdout
    Match       *
    Format      json
    json_date_format    iso8601

[OUTPUT]
    Name        es
    Match       *
    Host        127.0.0.1
    Port        9200
    Index       my_new_index
The first time you start feeding events to Elasticsearch, it will create a new "index" based on the name you provided above, and then you can use the "Discover" section of Kibana to start seeing your data flowing in.
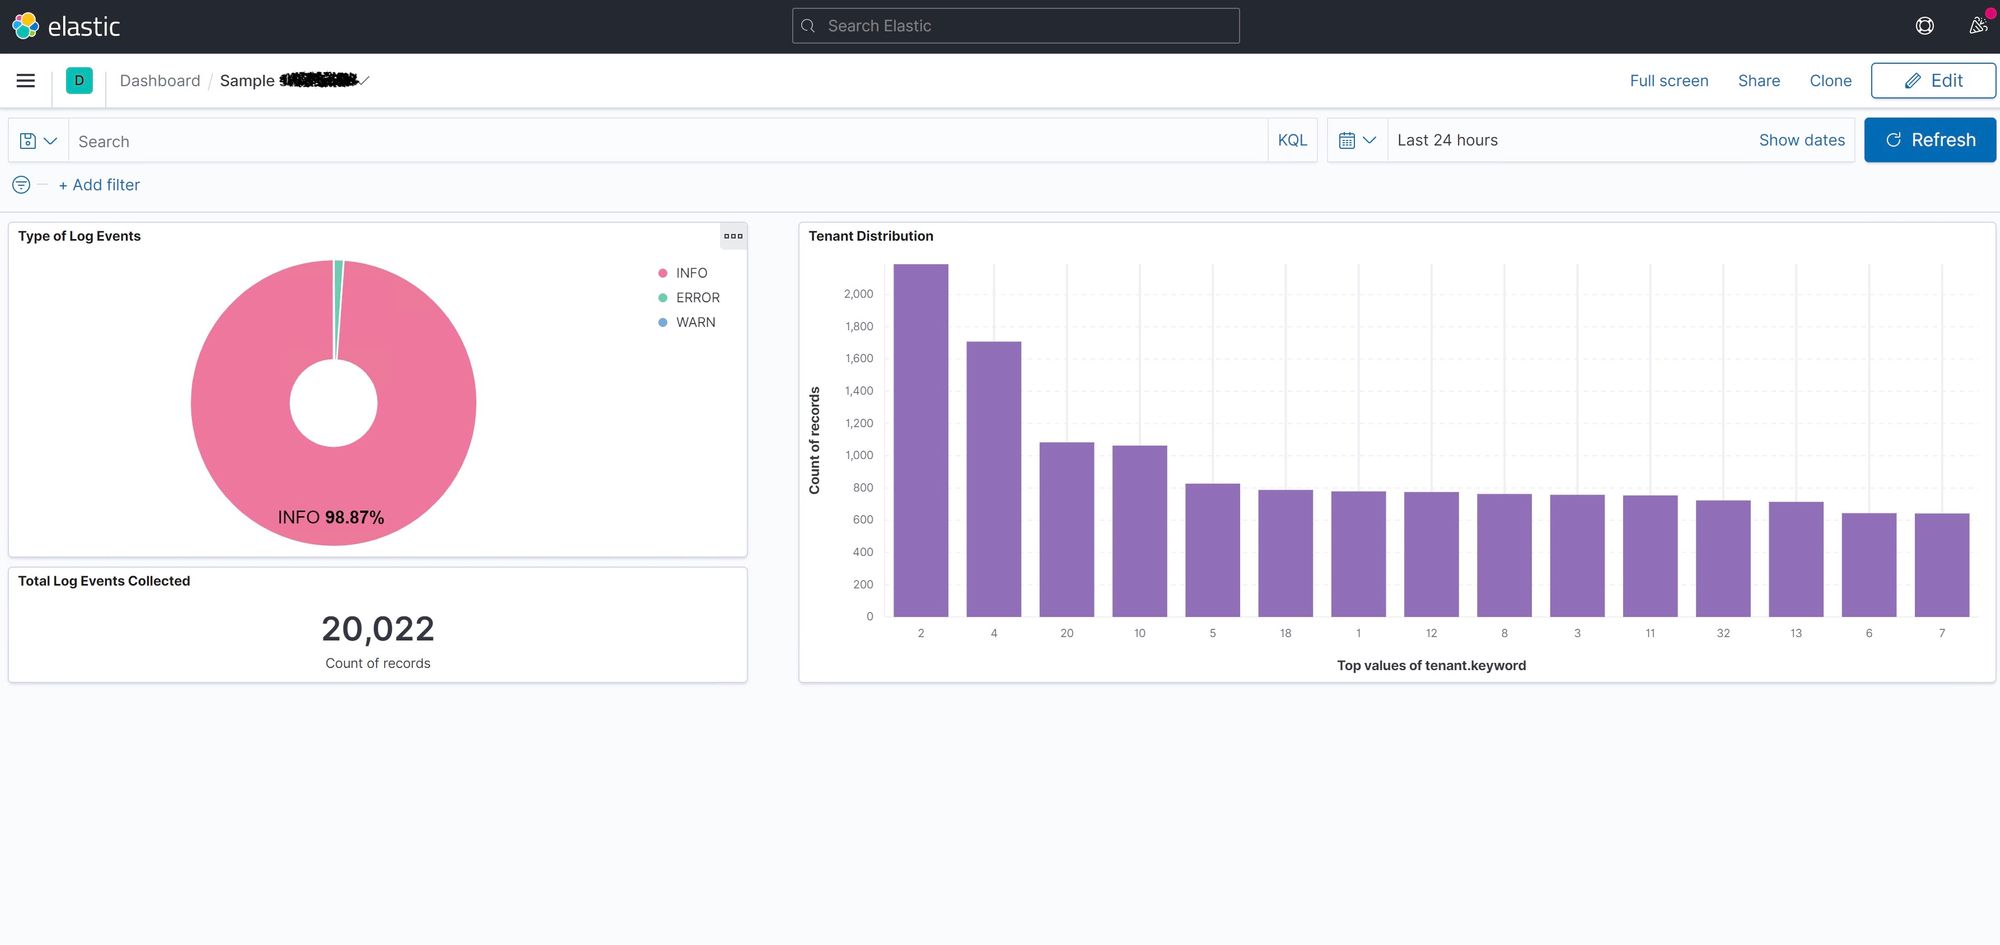
Spend time in "Discover" to get a feel for its filtering and sorting capability, and then try creating a new dashboard to chart some of the data (for example, a pie chart showing INFO, WARN, and ERROR messages):

Next steps
There is a great deal more to explore as you start feeding data into your stack. The FluentBit side allows you to parse out key data elements from log lines which then become explicitly searchable in Kibana (such as "tenant" in the example above). As you think about how this might go into production, with multiple sources feeding into it, you'll want to parse out things like:
- event timestamp, obviously
- log type (DEBUG, INFO, WARN, ERROR)
- some kind of process identifier
- trace and span identifiers
- customer/client/source identifier
Note that the full text is always searchable, but by pulling out key values, they become indexed separately and so become powerful filtering values in your visualizations.
There will be much more on ELK/EFK in the coming weeks, so if you have not already, please subscribe to keep up to date.
To round things out, there are a couple of housekeeping items. First, I am considering moving the regular publishing date from Sunday morning to Monday or Tuesday. Those that know these things suggest there is better engagement that way, but I am soliciting feedback. Please let me know your thoughts at debugmsgio@gmail.com.
Second, I would like to give a shout-out to the developer community DEV.to, where I am cross-posting some of these essays. There is a lot of technical goodness at DEV.to, so please check it out.


